

|
ulmont posted:Bunch of graphs and tables that would be annoying to quote again So if I'm reading this correctly, I think I have a solution for reducing the number of boring football games: 
|
 #
?
Oct 14, 2016 18:06
#
?
Oct 14, 2016 18:06
|
|


|

|
| # ? Apr 23, 2024 10:15 |
|
|
That's neat. I was a little surprised that Dolphins-Pats game from 2007 was on the least exciting list over this one: http://www.pro-football-reference.com/boxscores/200711180buf.htm but I had forgotten the Bills had scored an early TD to cut the lead 14-7 in the 1st quarter Add a fumble 6 to start the 4th quarter and the Pats had 8 TD's in 7 offensive possessions before they ground out the clock.
|
|
#
?
Oct 14, 2016 18:08
|
|


|
I understand maybe why the Excitement Index thinks PHI-CIN 2008 is worthy of being on the list, because WPA is calculated off of how much the chance of winning changes from one play to the next. Games that are tied literally can't get closer in score, so any gain or loss is gonna swing it back and forth. However, that's the game that ended in a 13-13 tie, and had McNabb's famous quote about not knowing how overtime worked. I can guarantee you it was not actually an exciting game. I think the graph may actually be broken as well. For some reason the page freezes when I try to grab the image, but it jumps and drops to 100% PHI Win multiple times and I think that's bad data because of the tie. http://www.pro-football-reference.com/boxscores/200811160cin.htm
|
|
#
?
Oct 14, 2016 18:22
|
|

|
Badfinger posted:However, that's the game that ended in a 13-13 tie, and had McNabb's famous quote about not knowing how overtime worked. I can guarantee you it was not actually an exciting game. Looking at the chart, each play definitely seems to be doing something significant to the game as a whole. 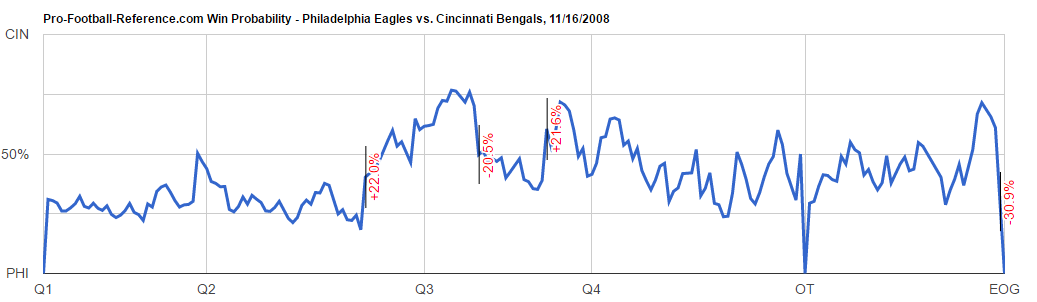 Badfinger posted:I think the graph may actually be broken as well. For some reason the page freezes when I try to grab the image, but it jumps and drops to 100% PHI Win multiple times and I think that's bad data because of the tie. That graph is broken, which is inflating that game by 0.31 (jump from 0 at play 1 to 31% at play 2) + 0.50 (drop from 50% at play 168 to 0 at play 169, right at OT), + 0.084 (difference between a drop from 50% at play 168 to 29.4% at play 170 and a jump from 0% at play 168 to 29.4% at play 170), so has 0.894 extra pieces of expected value. Even if you back that out that extra, though, that game would still be 20th on the list.
|
|
#
?
Oct 14, 2016 18:37
|
|

|
Kalli posted:That's neat. I was a little surprised that Dolphins-Pats game from 2007 was on the least exciting list over this one: http://www.pro-football-reference.com/boxscores/200711180buf.htm but I had forgotten the Bills had scored an early TD to cut the lead 14-7 in the 1st quarter I'm surprised the Titans/Patriots snow game didn't make it. http://www.pro-football-reference.com/boxscores/200910180nwe.htm
|
|
#
?
Oct 14, 2016 19:20
|
|

|
Jiminy Christmas! Shoes! posted:I'm surprised the Titans/Patriots snow game didn't make it. I need to recalculate to take into account that a number of these win probability charts seem to have a fake 0 at the beginning. Mind you, even with that this game would only move up to around 22; the first quarter had some swings back towards the Titans before everything went to hell. ...keep in mind the worst possible score a game could have would be around 0.20, representing a team that came in with a 20% chance to win and then never made a single play improving its position. Anything less than 1 or 2 shows a team getting its rear end kicked.
|
|
#
?
Oct 14, 2016 19:38
|
|
|
I just did some quick mixed-effect regressions, and starting with a baseline model under which every year-week has its own random, independent intercept*, all other factors explain basically zero variance. So from this approach (treating year-weeks as randomly sampled from a theoretical larger population of year-weeks) there is no difference between excitement for the different NFL broadcast programs. However, given that there looks to be a trend, it probably makes more sense to treat year-weeks as dependent and do some sort of growth-curve type thing to test this trend. Then the programming factor can be tested again from this baseline. I'll do this next. *lmer(1 + (1 | year.week)), if this means anything to you, where year.week is a factor like "2014.1" that distinguishes both year and week. There may be a better way to handle the error term though, so do let me know if you disagree with my approach. SurgicalOntologist fucked around with this message at 19:52 on Oct 14, 2016 |
|
#
?
Oct 14, 2016 19:49
|
|

|
ulmont posted:Looking at the chart, each play definitely seems to be doing something significant to the game as a whole. Oh I understand. Excitement Index is calculating how much the absolute value of win probability change moves. There are two important points - 1) Excitement Index is cumulative. This game got a full 15 extra minutes to add WP% changes over the usual game (and even most overtimes games). 2) It's not a subjective (and definitely not objective) measurement of actual game goodness. This game had a lot of plays that moved the graph a small amount, rather than wild swings from big plays. It had 21 punts and a team that had the ball for 41 minutes didn't even generate 300 yards of offense. This was a lovely game that stayed close the whole time because the offenses were inept.
|
|
#
?
Oct 14, 2016 20:20
|
|
|
Badfinger posted:1) Excitement Index is cumulative. This game got a full 15 extra minutes to add WP% changes over the usual game (and even most overtimes games). Badfinger posted:2) It's not a subjective (and definitely not objective) measurement of actual game goodness. This game had a lot of plays that moved the graph a small amount, rather than wild swings from big plays. It had 21 punts and a team that had the ball for 41 minutes didn't even generate 300 yards of offense. This was a lovely game that stayed close the whole time because the offenses were inept.
|
|
#
?
Oct 14, 2016 20:28
|
|
|
It's not going to distinguish clownball from excellent play but at a glance I think it's actually a pretty good measure, once you fix that OT artifact (it's a swing from ~50 to 0 and back up to ~50) and the extra 25% bonus.
|
|
#
?
Oct 15, 2016 01:52
|
|

|
pangstrom posted:It's not going to distinguish clownball from excellent play but at a glance I think it's actually a pretty good measure, once you fix that OT artifact (it's a swing from ~50 to 0 and back up to ~50) and the extra 25% bonus. I don't know, I think the 25% bonus should be left in. It IS more football, and it IS usually more exciting since it's a tie game. Why not leave it in?
|
|
#
?
Oct 15, 2016 10:19
|
|

|
Yeah that's reasonable. Also, it's only 25% extra on the tie games, I suppose; normally OT doesn't last that long.
|
|
#
?
Oct 15, 2016 11:18
|
|
|
ulmont posted:This is a good point and probably should be accounted for. Excitement Index is explicitly biased towards a fast moving game with lots of plays, but that seems fair over 4 quarters. But yeah, adding a 5th full quarter may be a bit much. To be clear, I'm not criticizing your measure. I think it's fun and it does basically what you've set out to do. It just needs the context that it's not thinking about things it's just adding up net change in game state. A 1st down at the 45 for a team down 4 points in the late 3rd quarter is an "exciting" game state with lots of volatility for gains and losses, it doesn't know that the field position is due to a shanked punt or stupid penalties or mud or whatever. A game with 7 field goals could end up on the list or not depending on if they all happened in the 4th quarter or the 2nd quarter. That might actually be a really fun game to watch, it just doesn't square with what many people think of when you ask them to name an "exciting" football game. Badfinger fucked around with this message at 14:46 on Oct 15, 2016 |
|
#
?
Oct 15, 2016 14:44
|
|
|
pangstrom posted:It's not going to distinguish clownball from excellent play but at a glance I think it's actually a pretty good measure, once you fix that OT artifact (it's a swing from ~50 to 0 and back up to ~50) and the extra 25% bonus. New data uploaded with that fix - fixes 2 things: 1) Games starting with the probability set to 0 or 1 (every game prior to 2012, it looks like) 2) Any plays where the data is empty ("169,0,null,null,null"), such as that OT artifact. Shuffles the top ten and bottom ten a little, because everything prior to 2012 had about an extra 0.5 change on average, but overall doesn't change too much. pre:Buffalo Bills Minnesota Vikings 9/15/2002 11.8277 New Orleans Saints San Francisco 49ers 1/14/2012 11.505491 Detroit Lions Green Bay Packers 1/1/2012 10.880684 Kansas City Chiefs Tennessee Titans 12/13/2004 10.79989283 San Francisco 49ers Arizona Cardinals 11/25/2007 10.6641052 Carolina Panthers Cincinnati Bengals 10/12/2014 10.6120088 Dallas Cowboys Arizona Cardinals 12/25/2010 10.5376832 New York Jets Miami Dolphins 9/23/2012 10.46192 Philadelphia Eagles Cincinnati Bengals 11/16/2008 10.427778 Chicago Bears Detroit Lions 10/18/2015 10.426898 pre:Miami Dolphins New England Patriots 12/23/2007 0.144178 San Francisco 49ers Chicago Bears 10/29/2006 0.203514 Jacksonville Jaguars Seattle Seahawks 9/22/2013 0.230944 New England Patriots Miami Dolphins 10/21/2007 0.297118575 Indianapolis Colts Baltimore Ravens 12/11/2011 0.306954 Indianapolis Colts New Orleans Saints 10/23/2011 0.308264 Oakland Raiders New York Giants 10/11/2009 0.321418 Jacksonville Jaguars Atlanta Falcons 12/15/2011 0.336942 San Francisco 49ers Jacksonville Jaguars 10/27/2013 0.33883087 New England Patriots Buffalo Bills 11/18/2007 0.350417194 Badfinger posted:To be clear, I'm not criticizing your measure. I think it's fun and it does basically what you've set out to do. It just needs the context that it's not thinking about things it's just adding up net change in game state. Oh, sure, I understand. I'm just saying that I'm open to other measures or modifications - is there some sort of list of generally accepted most exciting games ranked? If so, it would be interesting to see how they look on this Excitement Index and consider modifications that would better match that ranking...
|
|
#
?
Oct 15, 2016 16:27
|
|
|
Since there seems to be some discontent with the "win probability changes" -> "higher game excitement" model, what could be done (if one was dedicated enough) would be to manually take a dozen or so games and give each drive (or play if you're feeling dedicated) an excitement rating. These games would have to be a range of average games, actually and falsely "exciting" games, and actually and falsely "boring" games. This could be used to train the machine to recognize what makes an exciting play/drive/game and what doesn't so it would be able to automatically assign excitement ratings to all other drives/games. This would be Supervised Machine Learning which is a pretty fun topic. My earlier estimate of a "dozen or so" rated games may be off unfortunately. Because the excitement of a given play/drive/game depends on the state of the game, dozens (or even hundreds) of games might have to be rated for that to work. If I had the means, this would be great intern or grad student work, and would probably be picked up by the NFL or some other big organization to guide automated game or week replay reels (or even making Red Zone more interesting?).
|
|
#
?
Oct 16, 2016 16:47
|
|
|
Well, I think you'd first have to come up with what "on paper" (i.e. features that could be fed to the model) the excitement index isn't including. -stakes of the game (including rivalry). -a few plays are super exciting when the win probability fluctuates WITHIN the play, like double turnovers, even though the play's net effect might be little -a few kinds of narratives are probably on paper. Kicker who has missed twice already gets a last shot at the end of the game, stuff like that. Some of the stuff isn't on paper, though. Like ridiculous catches, near misses on bombs, dropped easy interceptions, huge hits, fights on the field, other narratives (e.g. Namath saying Jets would win), etc. Maybe somebody with the time could go through some "greatest games of all time" lists to come up with a scatterplot of how they look re: excitement index, and guess how much of that error term is obtainable on paper.
|
|
#
?
Oct 16, 2016 17:07
|
|
|
That's the beauty of machine learning - you don't have to program in specific situations or narratives or whatnot. If you have a rich enough dataset (like that provided by nflgame) the machine will (hopefully) start to draw conclusions about that stuff just from the training data you give it. This page gives all of the Stat types available for every play from nflgame. For example, a query like this:code:pre:(KC, DEN 5, Q1, 2 and 5) (8:24) (Shotgun) A.Smith pass incomplete short left to J.Maclin. 0 (DEN, DEN 5, Q1, 3 and 14) (6:51) (Shotgun) P.Manning pass incomplete deep left to E.Sanders. 38 (KC, KC 31, Q1, 3 and 24) (3:35) (Shotgun) A.Smith pass incomplete short right to A.Wilson. 6 (DEN, DEN 11, Q1, 1 and 10) (3:21) P.Manning pass incomplete deep left to E.Sanders (M.Peters) [T.Hali]. 17 (DEN, 50, Q2, 3 and 3) (6:37) (Shotgun) P.Manning pass short right intended for D.Thomas INTERCEPTED by M.Peters at KC 45. M.Peters for 55 yards, TOUCHDOWN. 5 (DEN, DEN 20, Q2, 1 and 10) (6:22) P.Manning pass incomplete short right to R.Hillman (J.Fleming). 5 (DEN, KC 35, Q2, 1 and 10) (4:03) (Shotgun) P.Manning pass incomplete deep right to D.Thomas (M.Peters). 30 e: So a lot more is "on paper" than it may be given credit for. You're right though, it can't see circus catches, near misses, etc. It would certainly trend all plays like that towards the mean instead of giving them their "full" excitement rating. CzarStark fucked around with this message at 20:30 on Oct 16, 2016 |
|
#
?
Oct 16, 2016 20:26
|
|
|
Yeah, the problem with just doing a "let god sort it out" approach is that you're going to overfit the thing and end up modeling noise if you give it too much to work with. Basically your model is going to work great retrospectively, but it's going to form weird opinions like "23 rushing attempts=exciting game" that aren't actually going to be predictive.
|
|
#
?
Oct 17, 2016 01:25
|
|
|
I wonder if there is a way to account for exciting plays that don't show up on a stat sheet. For instance, a fumble that is recovered by the offense after bouncing around a bit, or a pass that is tipped and both sides have a shot at it. There are tons of plays that are entertaining and exciting but have no effect on the game or stat sheet. Also, you need to account for the Butt Fumble factor. Like that game on paper was terrible, but it had the Butt Fumble so it was amazing.
|
|
#
?
Oct 17, 2016 11:21
|
|

|
swickles posted:I wonder if there is a way to account for exciting plays that don't show up on a stat sheet. For instance, a fumble that is recovered by the offense after bouncing around a bit, or a pass that is tipped and both sides have a shot at it. There are tons of plays that are entertaining and exciting but have no effect on the game or stat sheet. The only two things I could think of on that would be to either 1) See how many non-scoring plays from a game end up on nfl.com's highlights or 2) See how social media trends for the team during a game (might bias towards the major markets). Week 6 is over, here's what the EI says: 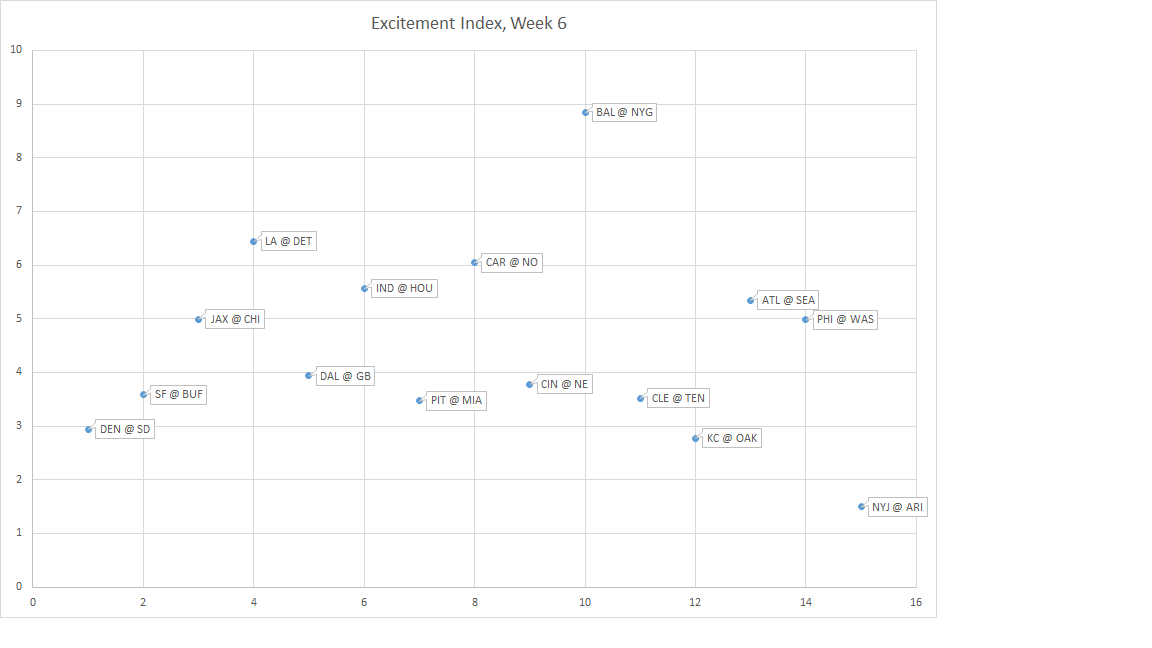 That surely looks right for Jets @ Cardinals - how was the Ravens @ NYG game?
|
|
#
?
Oct 19, 2016 01:45
|
|
|
Um, axes?
|
|
#
?
Oct 19, 2016 02:03
|
|
|
whypick1 posted:Um, axes? I actually should have deleted the X axis; it's just there to evenly space the games out. Y is Excitement Index; higher is better, and it's on a scale where 1.5 is "garbage" and 9 is "excellent"
|
|
#
?
Oct 19, 2016 02:39
|
|
|
I haven't read this whole paper yet but at the very least the lit review is amazing and  https://arxiv.org/pdf/1601.04302.pdf
|
|
#
?
Oct 23, 2016 06:06
|
|
|
ulmont posted:Oh, sure, I understand. I'm just saying that I'm open to other measures or modifications - is there some sort of list of generally accepted most exciting games ranked? If so, it would be interesting to see how they look on this Excitement Index and consider modifications that would better match that ranking... The other thing that skews past perception is often excitement is predicated on a single play or two. I keep maintaining the tie game I brought up was a bad game, mired in the baggage of a stretch of a season feeling like it was going nowhere, but maybe it was great to watch for an outside observer that didn't have the burden of rooting for those two teams. Whereas I think the Brandon Stokley tipped touchdown pass game must have been wildly exciting, and the last 2 minutes were crazy swings, but that was a sloppy 7-6 game before the tipped pass. One note, it would be interesting to line the week's games up on your graph from lowest to highest EI. They're just in the order they got pulled right now, right?
|
|
#
?
Oct 24, 2016 18:23
|
|
|
Badfinger posted:One note, it would be interesting to line the week's games up on your graph from lowest to highest EI. They're just in the order they got pulled right now, right? Yes, which is basically chronologically. Tanier had some other interesting items for consideration today: quote:Increased turnover rates: Bad games generally have more interceptions and fumbles. Some of those seem right (high penalties usually doesn't make a good game), but some of these seem bad (I'd rather see more turnovers and sacks in an otherwise relatively even game). Still, possibilities here; I think "increased punt rates" and "lower field-goal percentages" just mean "Tanier wants to see points on the board". So there could be some sort of bonus for turnovers and boosts for each team scoring say 17+ points.
|
|
#
?
Oct 25, 2016 17:12
|
|
|
Screw offensive linemen, let's watch defensive ends own it up and blitz concepts. Definitely check out the article besides the video. This is how 4 rushers beats 6 blockers. Eagles Defense Owns
|
|
#
?
Oct 25, 2016 22:11
|
|
|
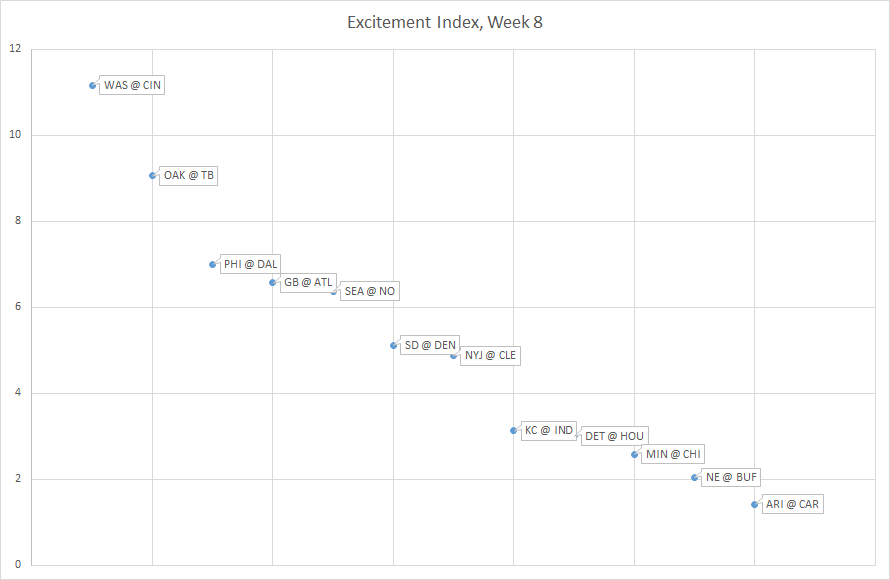
Badfinger posted:One note, it would be interesting to line the week's games up on your graph from lowest to highest EI. They're just in the order they got pulled right now, right? They tend to stack up a bit. Here's last week - you can clearly see the tie bonus. No surprises - tied games have exciting points, games that are in play down to the wire are exciting, and the Browns do not make for good football. 
|
|
#
?
Oct 28, 2016 01:30
|
|
|
I literally fell asleep at Levi's during TB @ SF so I can't imagine CLE @ CIN
|
|
#
?
Oct 28, 2016 03:17
|
|

|
Yeah seattle punt duel ")
|
|
#
?
Oct 30, 2016 11:21
|
|
|
The Raiders just saved this post from being entirely irrelevant within minutes of me finishing it: https://footballstatsaredumb.wordpress.com/2016/10/30/so-this-guy-at-the-bar-said-theres-more-ties-this-year-than-ever/ Basically I just wanted to lay the stats out there about what the historical number of ties in a season is and how likely it is we'll hit 3 this season. If you have stats training, ignore the last paragraph or you'll cringe.
|
|
#
?
Oct 30, 2016 21:50
|
|
|
 Another week! Unsurprisingly, the tie game and the two overtime games were the most exciting, followed by the two games where the game was in play until the last 0:30 (or last 0:02), then the surprisingly good Browns game, and then 5 trash games.
|
|
#
?
Nov 2, 2016 02:38
|
|
|
This isn't really a data driven post, but I do want to chime in a bit on some misinformation I am seeing about Alex Smith and the Chiefs. There are a lot of misconceptions out there that are being perpetuated. I do want to say that the Chiefs have earned the benefit of the doubt in regards to how they treat players. I say that because they held Alex Smith out in a playoff game when they thought he might have had a concussion and ultimately he did not. To me that shows a bit of good faith on their part. Anyways, I think I will do this by bullet point. 1.) A hard hit and the head contacting a surface means a player is concussed. A lot of people are saying "he clearly has a concussion, look at the hit!" Yes, the hit looks bad, but I have seen people come in from horrific car or motorcycle accidents where despite having been clearly struck in the head have had no concussion symptoms on either initial evaluation or even further investigation. A concussion may have occurred and not be symptomatic, however the game of football would simply be unplayable if we held that standard. Still, that should be a trigger for evaluation. 2.) He looks glazed and confused! I hate when people try to pull this diagnosis from afar bit. Now if a guy is stumbling around, vomiting, passes out, gets back up and such, I will take that as a good sign they have a concussion. But I am reading and hearing announcers say things like "look at his eyes". No, that doesn't do anything. I could post a hundred .gifs of players looking "glazed" who didn't even play a snap in the game. Allergies, getting hit in a way that causes a tearful response, weather and temperature can all cause this supposed "glazed/dazed" look that lots of talking heads seem to reference. I will take the word of a medical professional who is actually talking to a player over that of an announcer. 3.) We need to stop thinking that concussion are simple and easy to diagnose. The other criticism I am seeing is that the Chiefs (and NFL in general) take too little time to adequately check for a concussion. I have honestly no idea what you would do if they passed the initial tests. You give them a battery of questions, things like spelling, addition and subtraction, naming of objects, basic recall of facts, orientation to time, place, and person, etc. I can do all of that in like 2 minutes tops. The problem isn't the administration of the tests, but the fact that there isn't really any good test for a concussion. You may monitor them, but if you go the monitoring route you are essentially taking them out of the game. Like they may pass the tests, but be in the middle of a blackout. The only way to know would be asking them several hours later. Now, soon there should be some technology that will be able to objectively identify signs of a concussion and that will definitely change the game, but until then there isn't much you can do beyond initial screening and waiting to see. 4.) We need to realize that concussions and large hits aren't the real problem. The CTE/concussion problem is very much a problem of optics. Yes, getting concussed is bad, and if a concussed player were to make it back into th game and suffer another hit resulting in permanent injury or death, the uproar would be huge. But if we really care about CTE and the chronic effects that happen years after retirement, then we shouldn't focus on concussions. Again, they look terrible but we also need to adjust the constant sub-concussive blows suffered primarily by linemen and running backs. Remember when I said getting a concussion but not showing any symptoms of it? That can happen, and sneak past even the best medical staff with the technology we currently have. So, between insufficient science and the frequency of blows to the head that do not result in a visible concussion, we have a much bigger problem in terms of CTE than "clearing a player too fast".
|
|
#
?
Nov 2, 2016 03:20
|
|
|
BTW, from the eyeball test, there doesn't seem to be much if any correlation between how exciting a game is and how the spread was, other than that the games with extremely large spreads (Cleveland at Cincinnati, that sort of thing) tend to be bad.
|
|
#
?
Nov 4, 2016 02:08
|
|
|
And why let the fact that we the US elected a racist, sexist, xenophobic Cheeto get us down?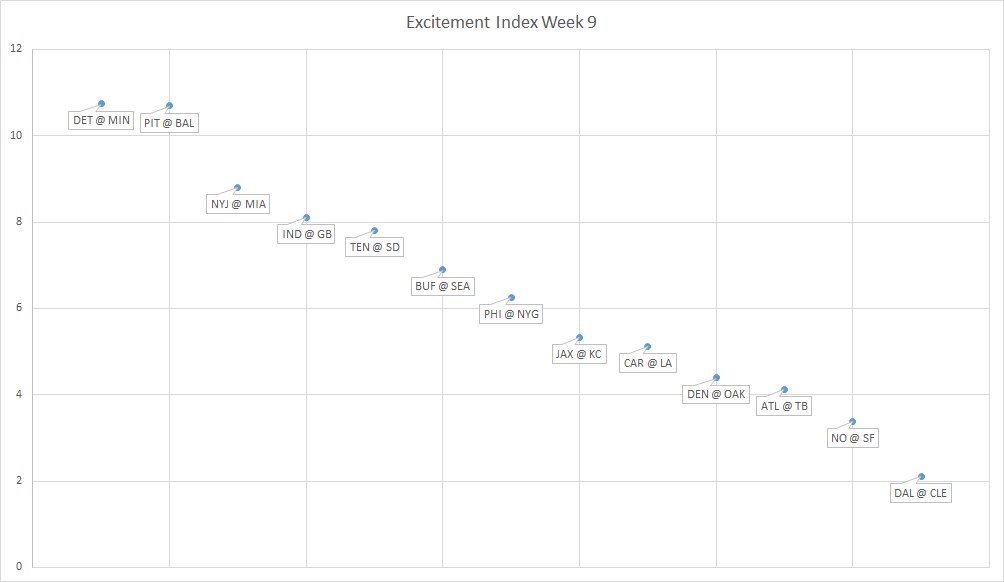 This actually looks to have been the best week of football this season. However, the PIT @ BAL data is all hosed up and I have to email them about the win probability chart. In the 3rd-4th quarter it just goes off the rails: 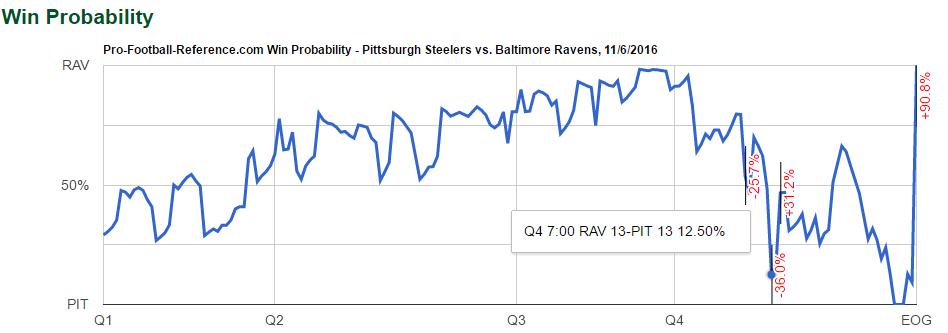 ...from the box score you can tell it was impossible that at any point was there a 13-13 tie.
|
|
#
?
Nov 10, 2016 05:23
|
|
|
NO @ SF was far more interesting than that lets on, but I get how far down it is because of your model. The game was pretty much in hand the whole way but there was a bunch of scoring which was fun. I'd be interested to see how much that changes if the Niners don't fumble away on the goal line and make the game closer.
|
|
#
?
Nov 10, 2016 05:48
|
|
|
Spoeank posted:NO @ SF was far more interesting than that lets on, but I get how far down it is because of your model. The game was pretty much in hand the whole way but there was a bunch of scoring which was fun. I've seriously considered adding in bonuses for touchdowns and turnovers, if I can find a way to do it that's at least model-based rather than completely subjective (after all, touchdowns and turnovers do change win probabilities, so they are somewhat baked in during the beginning). One thing I've considered is weighting the value of win probability changes quarter by quarter - right now, a game that is completely boring and 0-0 until the 4th quarter but then goes back and forth will get an Excitement Index score that would be a lot higher than deserved. This would, of course, make the Saints-Giants 52-49 game from 2015 probably have the highest possible Excitement Index score of any game in the history of football, so I'm not sure it's the right approach. Spoeank posted:I'd be interested to see how much that changes if the Niners don't fumble away on the goal line and make the game closer. Not a lot in all probability - I've highlighted the play and it seems to have dropped the Niners only 0.125 WP. 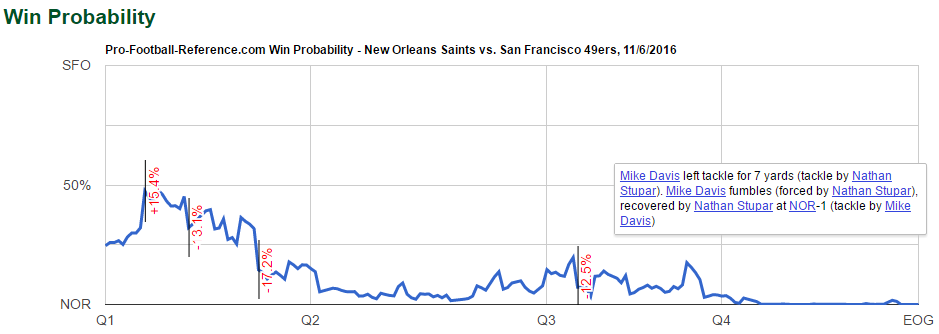
|
|
#
?
Nov 10, 2016 07:00
|
|
|
Updated week 9 (with the correct data, the Ravens-Steelers game is exposed for the garbage it was):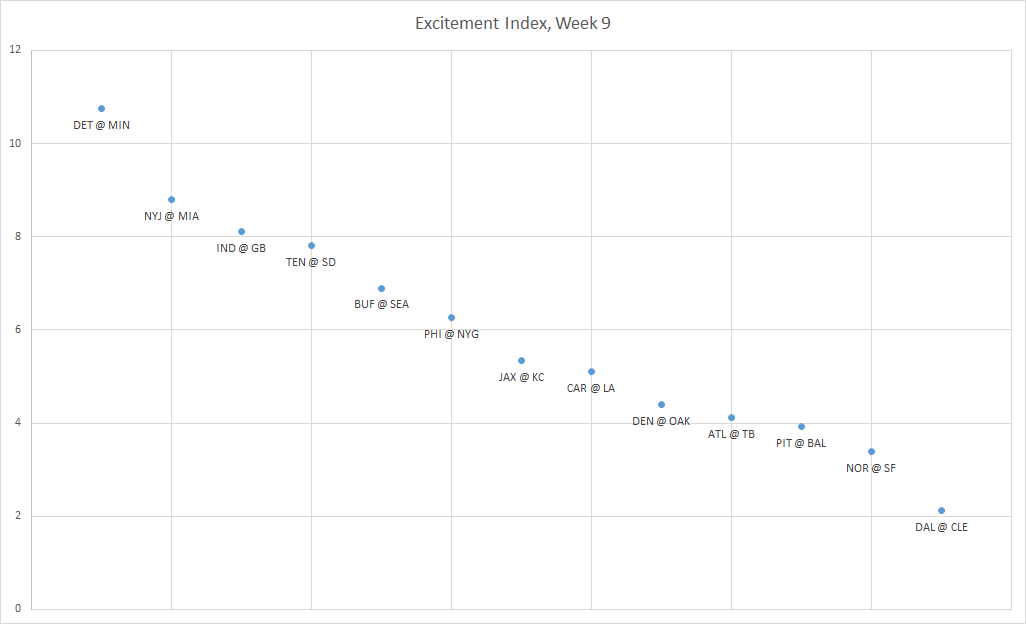 And here's week 10, showing the Saints losing in an exciting heartbreaker yet again: 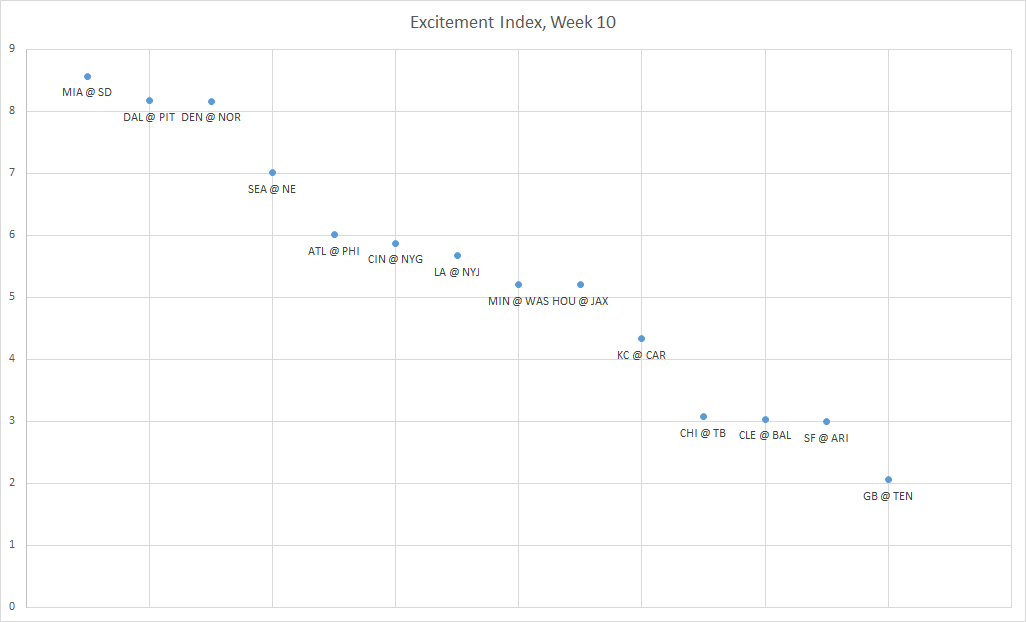
|
|
#
?
Nov 19, 2016 19:08
|
|
|
Can you plot a week's games as Excitement Index vs the absolute value of the spread? I wonder if lower-spread games are usually more exciting, especially since the graph takes that into account.
|
|
#
?
Nov 19, 2016 19:15
|
|
|

|
| # ? Apr 23, 2024 10:15 |
|
|
CzarStark posted:Can you plot a week's games as Excitement Index vs the absolute value of the spread? I wonder if lower-spread games are usually more exciting, especially since the graph takes that into account. I can (and I have, see below), but it's not interesting or useful. The problem is that most weeks the spreads range from 1-3 without a lot of variation. For example, last week spreads (taken from SAS Eliminator): pre:1 LA @ NYJ 1 CIN @ NYG 2 ATL @ PHI 2.5 CHI @ TB 2.5 MIN @ WAS 3 KC @ CAR 3 HOU @ JAX 3 DEN @ NOR 3 GB @ TEN 3 DAL @ PIT 4 MIA @ SD 7.5 CLE @ BAL 7.5 SEA @ NE 13.5 SF @ ARI 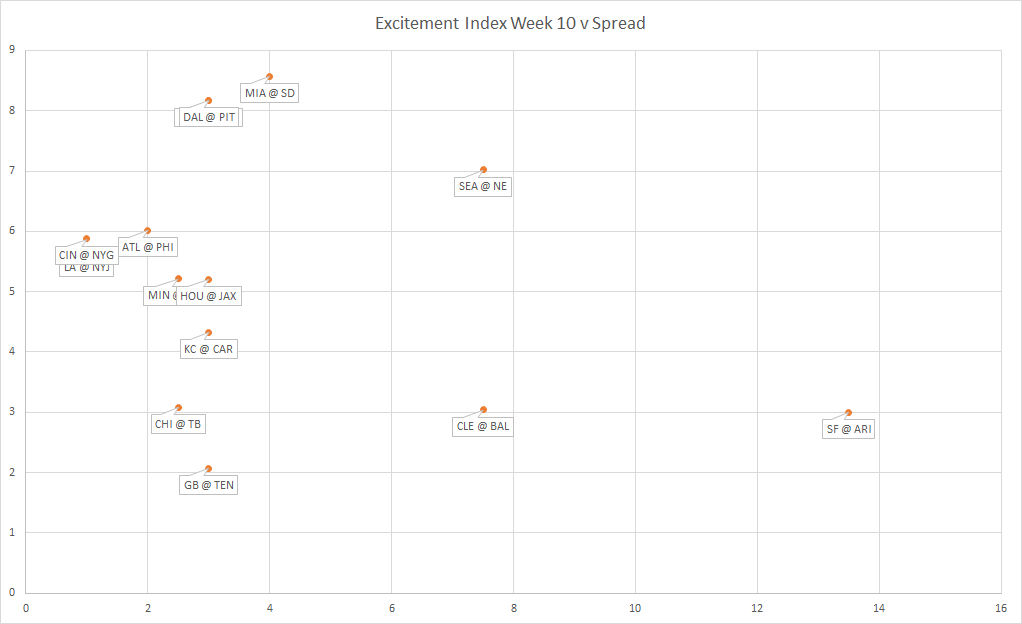
|
|
#
?
Nov 19, 2016 19:35
|
|