|
Why don't we have a polls thread? I don't want to go through 70 pages of people talking about hats in the Donald Trump thread every time I want to talk about POLLS! Fresh for today. Hillary still dominating in New Mexico, and she's even in front in the infamous LA times poll: 
|
 #
?
Aug 24, 2016 13:46
#
?
Aug 24, 2016 13:46
|
|


|

|
| # ? Apr 19, 2024 03:16 |
|
|
Florida: Trump 43%, Clinton 41% (Florida Atlantic University)
|
|
#
?
Aug 24, 2016 14:04
|
|
|
ed polls
|
|
#
?
Aug 24, 2016 20:38
|
|

|
http://election.princeton.edu/ /thread 
|
|
#
?
Aug 24, 2016 21:18
|
|


|
Grand Theft Autobot posted:ed polls
|
|
#
?
Aug 25, 2016 08:13
|
|

|
when im feelin down i look at this one and laaaaaugh 
|
|
#
?
Aug 25, 2016 08:17
|
|


|
i loving love polls
|
|
#
?
Aug 25, 2016 10:34
|
|

|
not really they're just ok i guess
|
|
#
?
Aug 25, 2016 10:37
|
|
|
Does no-one want to discuss poll though? Like the 50 state shitshow that ipsos just released which shows trump up in Maine and tied in Wisconsin and PA?
|
|
#
?
Aug 25, 2016 11:15
|
|
|
http://polling.reuters.com/#!poll/TM651Y15_DS_13/filters/LIKELY:1/type/smallest/dates/20160710-20160823/collapsed/true/spotlight/1 Why is there no discussion of the new Reuters that shows Hillary with an 11 point lead? It's been out for days and RealClearPolitics still doesn't include it.
|
|
|
#
?
Aug 25, 2016 11:50
|
|

|
rcp is kinda weird sometimes
|
|
#
?
Aug 25, 2016 11:54
|
|
|
they've been around forever but they're not exactly like an authority
|
|
#
?
Aug 25, 2016 11:54
|
|
|
Polls
|
|
#
?
Aug 26, 2016 03:40
|
|
|
Polls polls polls polls polls polls
|
|
#
?
Aug 26, 2016 04:24
|
|


|
SimonChris posted:http://polling.reuters.com/#!poll/TM651Y15_DS_13/filters/LIKELY:1/type/smallest/dates/20160710-20160823/collapsed/true/spotlight/1 reuters sucks
|
|
#
?
Aug 26, 2016 04:33
|
|

|
It looks like RCP only uses that tracking polls numbers on Wednesdays?
|
|
#
?
Aug 26, 2016 04:42
|
|
|
statistics are a lie the universe is random chaos with no meaning or ability to predict anything the faster you abandon all hope the better you'll be
|
|
#
?
Sep 1, 2016 16:32
|
|

|
Chokes McGee posted:statistics are a lie the universe is random chaos with no meaning or ability to predict anything One may predict how loving awful your posts will be with perfect accuracy actually.
|
|
#
?
Sep 1, 2016 17:47
|
|

|
Goon project is actually going pretty well, D&D Commissions a Poll Donate some money for a little home grown fun down in the DEEP SOUTH
|
|
#
?
Sep 1, 2016 22:37
|
|


|
This is a great project. If we get $3000, we can ask 10 questions. This could be the only successful goon project since swap.AVI
|
|
#
?
Sep 2, 2016 05:07
|
|
|
tsa posted:One may predict how loving awful your posts will be with perfect accuracy actually. perhaps one ought not to throw stones when they post in gbs regularly
|
|
#
?
Sep 2, 2016 17:13
|
|
|
Chokes McGee posted:statistics are a lie the universe is random chaos with no meaning or ability to predict anything Untrue. For example: Death is in fact certain.
|
|
#
?
Sep 2, 2016 18:05
|
|

|
Emerson IA poll Trump 44 Clinton 39 Johnson 8 Stein 1
|
|
#
?
Sep 2, 2016 18:12
|
|
|
Vox Nihili posted:Emerson IA poll Trump 44 Clinton 39 Johnson 8 Stein 1 Vox Nihili posted:Untrue. For example: Death is in fact certain. checks out
|
|
#
?
Sep 2, 2016 19:08
|
|
|
I have no idea which buttons to push on the internet to get this but can someone post a graph of where Obama/McCain and Obama/Romney was at this point and time? Because I remember specifically Arzying like poo poo this time of year in 2008 but I want objective proof of
|
|
#
?
Sep 2, 2016 19:17
|
|
|
Chokes McGee posted:I have no idea which buttons to push on the internet to get this but can someone post a graph of where Obama/McCain and Obama/Romney was at this point and time? Because I remember specifically Arzying like poo poo this time of year in 2008 but I want objective proof of Tl:dr Obama basically never went above +4 against Romney, and McCain was actually ahead-ish in September until he went completely tits up in October.
|
|
#
?
Sep 2, 2016 21:13
|
|
|
Chokes McGee posted:I have no idea which buttons to push on the internet to get this but can someone post a graph of where Obama/McCain and Obama/Romney was at this point and time? Because I remember specifically Arzying like poo poo this time of year in 2008 but I want objective proof of Obama led against McCain by around 2-8 points pretty much the entire time except for a few weeks in September: http://www.realclearpolitics.com/epolls/2008/president/us/general_election_mccain_vs_obama-225.html Obama led Romney by a few points for most of the race, but near the end it tightened up quite a bit: http://www.realclearpolitics.com/epolls/2012/president/us/general_election_romney_vs_obama-1171.html
|
|
#
?
Sep 3, 2016 01:11
|
|
|
It's pretty scary that Clinton only leads Trump by 3 to 4%.
|
|
#
?
Sep 3, 2016 01:21
|
|

|
punk rebel ecks posted:It's pretty scary that Clinton only leads Trump by 3 to 4%. Yeah it's not great, but so far it's been closer to the McCain race than Romney. Hopefully it won't continue to tighten--this has definitely been a bad week.
|
|
#
?
Sep 3, 2016 01:29
|
|
|
realclearpolitics has a bunch of 2016-2012-2008 comparisons for the primary, but i can't find a single website with all three for the presidential election. i did just post this in the trump thread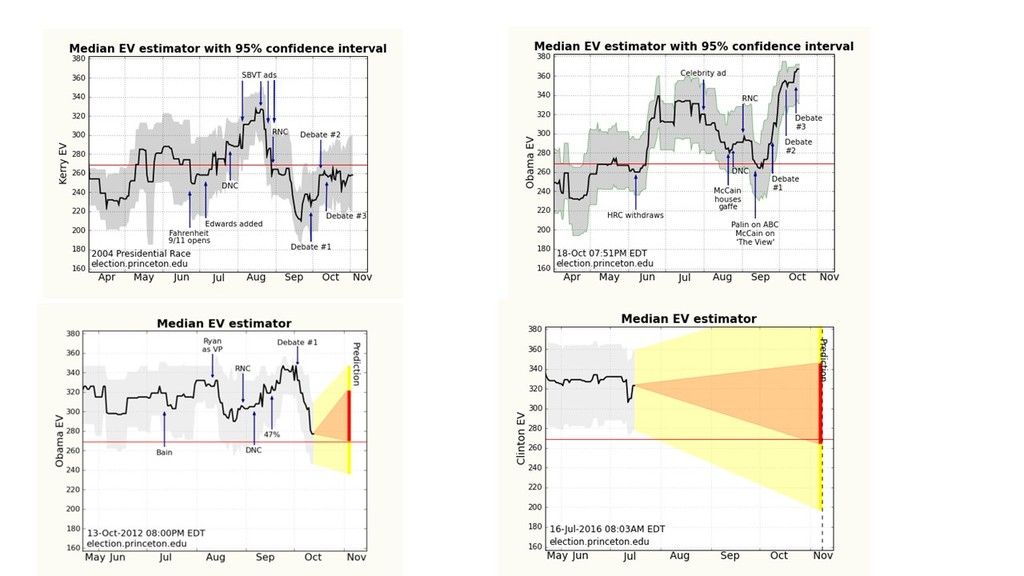 also i wonder if the pollsters are gonna turn up the volume or if we're gonna keep having like half as many polls as we did last cycle. it'd be very interesting if a bunch of house elections were going almost unpolled, for example but i'd really like to just have a deluge of polls every day for a shitload of elections, the way it was in 2012
|
|
#
?
Sep 3, 2016 01:36
|
|

|
My favorite part of this is how the line blasts off into the stratosphere after "Palin on ABC, McCain on The View"
|
|
#
?
Sep 3, 2016 02:02
|
|
|
Chokes McGee posted:My favorite part of this is how the line blasts off into the stratosphere after "Palin on ABC, McCain on The View"
|
|
#
?
Sep 3, 2016 02:07
|
|
|
what was the "mccain houses gaffe"
|
|
#
?
Sep 3, 2016 04:09
|
|


|
Couldn't remember how many houses he owned, I think.
|
|
#
?
Sep 3, 2016 05:18
|
|
|
oystertoadfish posted:Polls Why isn't the financial crisis listed there? I imagined that could have done a number on McCain who I believed stated that the economy was "just fine" not long before the crash. And yeah, these prove that polls don't mean that much until we are firmly in September.
|
|
#
?
Sep 3, 2016 06:31
|
|
|
yup! i have this in my copy paste thing so what the hell ill triplepost these graphs btw im sorta intrigued that sam wang's predictions haven't responded to The Tightening very much at all on the presidential level, but the house prediction has gone down sharply: http://election.princeton.edu/history-of-meta-analysis/   the senate one has dropped too  i feel like there's a very similar pattern in these but it's a little bit larger scaled in the house and the senate is crossing the line of control instead of going from +4 to +6 so it looks more interesting anyway there's definitely time for a big spike in one direction or the other, that's the important lesson from historical comparison graphs. i've posted rcp averages on the congressional preference question before and it's mostly been stable in the last decade or so but 2014 saw the gop surge to a lead, actually right about now, late august-early september http://www.realclearpolitics.com/epolls/other/generic_congressional_vote-2170.html you can't use the trendline to predict that graph. so maybe something like that, or the patterns in some of the presidential races, recurs. we'll all know in ten weeks i spose
|
|
#
?
Sep 3, 2016 18:30
|
|
|
Why are there so many fewer house polls this year? Is it because people figure the republicans will hold it so who cares?
|
|
#
?
Sep 3, 2016 18:36
|
|
|
i haven't done a count or even gone back to 4 year old daily kos elections daily digests to make an effort at the comparison, but i'm guessing that's the case i've heard there are about half as many presidential/senate polls, and i think the reason is that they generate less revenue than they cost to perform. if that's the problem, then house polls will have much lower interest, probably higher cost, and therefore you'd think they'd get hit worse than upticket polling but i dont really know that and maybe there are post-labor day contracts or something that'll come into effect as the campaign rolls on the generic congressional vote poll is a different thing. an individual congressional district needs to have its own call list and poo poo, but this generic number that sam wang is using in the graph above is just taking the same national pool you're using to get presidential numbers and asking them which party they expect to vote for at the house level, basically the relationship between that margin and actual congressional seat margin is pretty loose but it's a lot easier to get than real house-level polls oystertoadfish has issued a correction as of 18:46 on Sep 3, 2016 |
|
#
?
Sep 3, 2016 18:43
|
|
|
There has been less polling overall, and it makes sense that if there's less polling, that the first polls on the chopping block would be for House races. In general, that can be tied back to the 2010 redistricting, which has had some far-reaching consequences that make polling in the House less worthwhile, at least this cycle. First, there's just fewer competitive House seats now than at any point in a long time. For example, let's look at races where the range on the Cook Partisan Voter Index (CPVI), which measures a district's overall ideological lean, is from 4% Republican to 4% Democratic: Lean Republican districts (2-4% Republican lean): (26) - AZ-1, AZ-2 CA-25, CA-49, FL-7, FL-18, IL-6, IL-16, MI-3, NE-2, NJ-5, NY-1, OH-14, PA-6, PA-7, PA-15, PA-16, TX-23, VA-2, VA-4, VA-10, WA-3, WA-8, WI-1, WI-7, WI-8 Slight Republican districts: (1% Republican lean): (19) - AZ-9, CA-10, CA-36, FL-13, FL-26, FL-27, MI-6, MI-7, MI-8, MI-11, MN-1, MN-2, MN-3, NJ-3, NY-2, NY-11, NY-22, NY-23, PA-8 Tossup districts: (9) - CA-7, IL-12, IL-13, IA-3, NV-3, NY-3, NY-18, NY-21, OR-5 Slight Democrat districts: (1% Democratic lean): (4) CO-6, MN-8, NJ-2, NY-19 Lean Democrat districts (2-4% Democratic lean): (18) - CA-3, CA-21, CA-24, CA-26, CA-52, CT-5, FL-22, IA-2, IL-10, KY-3, MA-6, MD-6, ME-2, NH-2, NY-4, OR-4, PA-17, WA-1 That's only 73 out of 435 districts, and if you go up to 5% on both sides, the number only goes up to 90 seats. Now, to hammer this point home, here is how often people from those above districts elect a representative who is not from the party with whom their district aligns: Republicans in lean blue districts (2-4% Democratic lean): (3) - CA-21, IL-10, ME-2 Republicans in slight blue districts: (1% Democratic lean): (3) - CO-6, NJ-2, NY-19 Democrats in slight red districts: (1% Republican lean): (3) - AZ-9, CA-36, MN-1 Democrats in lean red districts (2-4% Republican lean): (3) - AZ-1, FL-18, NE-2 Only 12 of the 73 close districts deviated from their fundamentals even slightly. Oh, and of the 9 toss-up districts, 5 went Republican and 4 went Democrat. Of the remaining 362 districts, all of which have a 5% or greater partisan lean one way or the other, there's only 4 that elected someone from the opposite party: IA-1 (5% Democrat lean, went Republican in 2014) NY-24 (5% Democrat lean, went Republican in 2014) FL-2 (6% Republican lean, went Democrat in 2014) MN-7 (6% Republican lean, went Democrat in 2002) This clearly illustrates that although local races have the potential to go opposite to the district's partisan lean, they only do so very rarely, at only 3.7% overall. This indicates that there's relatively little impact made by the overall quality of the candidates, which just not the case in the Senate or Presidential elections. To contrast the House with the Senate, Illinois, Indiana, Maine, Missouri, Montana, North Dakota, and West Virginia are all 5% or greater on the PVI and have one senator from the opposite party to their partisan lean, and Iowa has a 1% Democratic lean, but has two Republican senators. Since the overall quality of a given candidate in the House has relatively little effect, polling on individual races seems far less useful than it would be for the Senate or the Presidency, and since pollsters don't have unlimited resources, each poll of an individual House race means that there's less resources to run on Senate, Presidential, or issue polls. Instead, the overall shape of the House's election results can be inferred from other data. Second, House races tend to follow economic conditions far more closely than the elections for the Senate or the Presidency, and the economy is pretty average right now and that seems likely to hold until election day. In this scenario, history tells us that there's not going to be huge shifts in the makeup of the House. This will likely work to keep Republican losses down, rather than exacerbate them as an election such as 2008, which was as much of a referendum on the economy as any election is ever likely to be. The closer we get to election day, the less potential there is for there to be a massive shift in the economy in either direction, so this factor looks to prevent wild swings, rather than encourage them, as it would if the economy took a nose-dive or unemployment was to suddenly decrease sharply/wages increase sharply. Third, while there has been much less ticket splitting in recent elections, polling for Senate candidates gives the indication that there'll be much more splitting than in previous years. Republican senate race polling doesn't look anywhere near as bad as Trump polling does, which is a powerful indicator that there's a good quantity of people who aren't voting for Trump but who are voting Republican downballot. While the inconsistency with history is a reason to look at it skeptically, the inordinate polling success of Johnson and Stein relative to 2012 is a powerful indicator that voters are looking at the top of the ticket differently in this election than in the last few elections. The real factor in whether the Democrats can flip the House is one that is essentially impossible to poll at this point, and that is voter turnout. I've said it a few times around here before, but this is the part of the election that's going to be studied for decades, since it'll be the only data point that we have for what happens when a presidential candidate just doesn't do their best at GOTV. I know that the RNC is trying to put it together for Trump, but if it was something that they had the ability, funding, and expertise to do as well as the candidate and seemingly without much help from the candidate, they would have been doing this all along, rather than relying on whoever was at the top of the ticket to do so, to say nothing about all the experienced people who are sitting out this election who would normally be a part of this. In 2012, Obama outperformed his polls on election night by about 3%. Yeah, the polls were skewed, just not how Republicans wanted them to be. Some napkin math tells me that this gap represents roughly 2 million voters, and while he beat Romney by roughly 4 million votes overall. He still would have won without it, but it's important to note just how much those extra voters help downballot candidates. In my numbers above, about 10% of all House districts are ones that lean Republican by less than 4% and have a Republican representing them. If those two million extra voters that Obama turned out were spread evenly between all districts, that means that the Democrats turned out roughly 200,000 voters in those districts alone that wouldn't normally have voted, or roughly 5,000 voters in each district. Now, I know that doesn't sound like a lot, but go look at the margins of victory for House candidates in 2012. There's plenty of districts where the vote is decided by tens of thousands of votes or less. Now, those 5,000 extra voters were with Romney pulling out all the stops on a GOTV campaign. Aside from Trump's almost inevitable cries of election rigging, what would happen if Hillary outperformed her polls even better than Obama? That could flip more than a few House seats, but there is absolutely no way to account for it by polling. TL;DR: Polling House races is really hard and there's not much benefit
|
|
#
?
Sep 4, 2016 06:22
|
|


|

|
| # ? Apr 19, 2024 03:16 |
|
|
538 has upped trump more than 15% during the last week. 28.5% = trump landslide gg
|
|
#
?
Sep 4, 2016 08:12
|
|