- computer parts
- Nov 18, 2010
-

PLEASE CLAP
|
Sounds like a good time to introduce the Monty Hall problem.
|
 #
¿
Sep 3, 2016 15:55
#
¿
Sep 3, 2016 15:55
|
|
- Adbot
-
ADBOT LOVES YOU
|

|
|
#
¿
Apr 28, 2024 16:23
|
|
- computer parts
- Nov 18, 2010
-
PLEASE CLAP
|
Okay, here's another one that got me thinking.
Take this distribution for the weight of adult males.

(You turn it into a probability distribution by dividing it all by the area under the curve, to give it a new area of 1.)
We can conclude from this distribution that "If you are an adult male, you probably don't weight 50 or 500 lbs." So picking an adult male from a phone book and getting a 50 pounder is not very likely.
Doing the same thing with the distribution of population as a function of year,
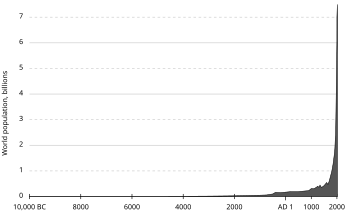
We see that "If you are a human life, you are more likely to happen in the 21st century than in the 1st century."
Okay, makes sense, it is likely that you would be alive now, when people are finding it particularly easy to be alive.
But . . . what about the time after the 21st century? If the population keeps going, or at least levels off, that would put you at a tail-end extreme of the distribution. This is not very likely. Thus, the fact that you are living now serves as evidence that it is unlikely that the human population will not be sticking around over 7 billion for long, and we are in for a catastrophic population crash in the near future.
Basically the second graph is not actually a probability distribution, though it might appear to be. All it's reporting is the number of people in a certain timeframe. You can extrapolate from that that people are more likely to be born when there's more people (for obvious reasons), but it's not relaying the same information.
The other thing is that in probability distributions you try to make it as close to a consistent system as possible - for example, the first graph might be "distribution of adult male weight for 2012", so the consistent part is that all the data was from one year. In the second graph, there's a clear shift about 1500 AD that makes it unlikely that the previous data has any relation to the succeeding data.
|
|
#
¿
Sep 8, 2016 15:36
|
|


 #
¿
Sep 3, 2016 15:55
#
¿
Sep 3, 2016 15:55

