|
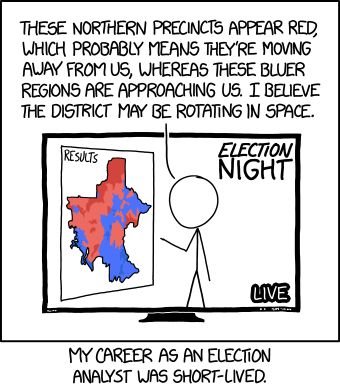
I have to admit, I was very unconvinced until I read that source at the bottom.
|
 #
?
Jun 17, 2017 09:18
#
?
Jun 17, 2017 09:18
|
|


|

|
| # ? Apr 19, 2024 21:04 |
|
|
Gifs of metros from around the world, morphing to and from their geographical layout: http://mymodernmet.com/animated-subway-maps/
|
|
#
?
Jun 18, 2017 02:20
|
|

|
Hyperlynx posted:Gifs of metros from around the world, morphing to and from their geographical layout: I'm Austin's embarrassing turd.
|
|
#
?
Jun 18, 2017 02:23
|
|

|
That's pretty cool. Too bad no one's done Chicago.
|
|
#
?
Jun 18, 2017 02:31
|
|
|
 First laugh I've gotten out of xkcd in months.
|
|
#
?
Jun 20, 2017 02:42
|
|
|
Eh, the goatkcd version is still better.
|
|
#
?
Jun 20, 2017 02:54
|
|

|
hooah posted:That's pretty cool. Too bad no one's done Chicago. Probably because it'll just look like a sphincter contracting.
|
|
#
?
Jun 20, 2017 05:38
|
|

|
Cross post from Auspol:
|
|
#
?
Jun 22, 2017 04:30
|
|


|
Zenithe posted:Cross post from Auspol: I�m the two Australians of different population existing right NOW.
|
|
#
?
Jun 22, 2017 04:53
|
|

|
Remember when Mark Latham almost became PM? EDIT: To help translate the graph further. "Sustainable" Australia is the one with just white people in it. "Big" Australia is the one filled with not-white people and therefore bad.
|
|
#
?
Jun 22, 2017 05:01
|
|


|
Australia would be even more sustainable if you kicked all the white people out too.
|
|
#
?
Jun 22, 2017 06:24
|
|


|
Is big Australia like big government or big capitalism?
|
|
#
?
Jun 22, 2017 11:14
|
|
|
Fathis Munk posted:Is big Australia like big government or big capitalism?
|
|
#
?
Jun 22, 2017 11:16
|
|


|
Fathis Munk posted:Is big Australia like big government or big capitalism? Pay attention: Gorilla Salad posted:
|
|
#
?
Jun 22, 2017 11:17
|
|
|
 I want to understand this but what?!
|
|
#
?
Jun 22, 2017 12:20
|
|

|
Fruit Smoothies posted:
Holy poo poo! What it�s saying is how rich is the median person of a generation compared to the previous generations at the same age. So ever since the boomers medium net worth has been on a downward trajectory And millennials now have a median 84% less wealth than other generations at their age.
|
|
#
?
Jun 22, 2017 13:09
|
|

|
Glazier posted:Holy poo poo! What it’s saying is how rich is the median person of a generation compared to the previous generations at the same age. So ever since the boomers medium net worth has been on a downward trajectory And millennials now have a median 84% less wealth than other generations at their age. Acacado toast 
|
|
#
?
Jun 22, 2017 13:31
|
|

|
Melbourne public transit map, 1910-1922.
|
|
#
?
Jun 22, 2017 13:32
|
|
|
Fruit Smoothies posted:
I'm the inverted x-axis hurtling backward through time.
|
|
#
?
Jun 22, 2017 13:38
|
|


|
Glazier posted:Holy poo poo! What it�s saying is how rich is the median person of a generation compared to the previous generations at the same age. So ever since the boomers medium net worth has been on a downward trajectory And millennials now have a median 84% less wealth than other generations at their age. Depending on what "physical wealth" is, it's probably a bit more than that.
|
|
#
?
Jun 22, 2017 13:40
|
|
|
The formulation "as a proportion of the preceding cohorts wealth" indicates to me that we have 84% less than the previous generation, which has itself 48% less that its own previous generation. Indicating that each new generation has gotten poorer for a long time. E: so we have 84% less than the the 81-85 generation, at the same age, but I guess its even worse when compared to the other generations. Fathis Munk has a new favorite as of 15:00 on Jun 22, 2017 |
|
#
?
Jun 22, 2017 14:58
|
|
|
Fruit Smoothies posted:
|
|
#
?
Jun 22, 2017 15:06
|
|

|
Fathis Munk posted:The formulation "as a proportion of the preceding cohorts wealth" indicates to me that we have 84% less than the previous generation, which has itself 48% less that its own previous generation. Indicating that each new generation has gotten poorer for a long time. Exactly, ever since the boomers generations have been getting poorer and poorer.
|
|
#
?
Jun 22, 2017 15:08
|
|
|
pangstrom posted:Will you link where it's from? Google image search isn't finding it for some reason.
|
|
#
?
Jun 22, 2017 15:09
|
|
|
Thanks. The "at same age" affects things (since people are earning money later and later each generation, and for the recent -84% you're basically comparing very young families). Also it's for Great Britain which I didn't notice at first (though it has a GB at end of title). Still pretty shocking.
|
|
#
?
Jun 22, 2017 15:21
|
|
|
cinci zoo sniper posted:Page 38 here: http://www.resolutionfoundation.org/app/uploads/2017/06/Wealth.pdf That huge drop appears to mostly be because of lack of property wealth. Younger people either can't afford to buy property because prices are too high, or if they did buy property, values have not gone up. Older generations were able to buy cheaper property and then values have skyrocketed over the last couple of decades. I also wonder if general health and lifespan increases has affected this a little bit. If our parents died earlier, then we would inherit their wealth sooner, inflating our net worth at an earlier age. Now, people are living decades longer some times, which means the younger generation has to wait longer for any inheritance (if there is an inheritance). Also, since the elderly are living longer, they are spending more of that money and passing less down to their kids.
|
|
#
?
Jun 22, 2017 15:53
|
|


|
Bird in a Blender posted:That huge drop appears to mostly be because of lack of property wealth. Younger people either can't afford to buy property because prices are too high, or if they did buy property, values have not gone up. Older generations were able to buy cheaper property and then values have skyrocketed over the last couple of decades. It's the accumulation of wealth by very few individuals that started in an era where social mobility was still possible. It's not that boomers are well off, it's that the people who are well off happen to be boomers.
|
|
#
?
Jun 22, 2017 16:30
|
|
|
ikanreed posted:It's the accumulation of wealth by very few individuals that started in an era where social mobility was still possible. It's not that boomers are well off, it's that the people who are well off happen to be boomers. Yeah, I imagine this graph would pair well with a graph of economic inequality over time (or like, it would if it was laid out in a way that made goddamn sense).
|
|
#
?
Jun 23, 2017 03:28
|
|

|
It says median, not mean. C'mon this is supposed to be a nerdthread
|
|
#
?
Jun 23, 2017 07:58
|
|

|
Fruit Smoothies posted:
Just outta curiosity I actually wanted to plot this using absolute values and not just variations, so I used 100 as my starting value of the very first cohort (for which the time-frame is unspecified)  E: wait, did I entirely misread how the graph is actually made? They say preceding cohort but does that mean they compare variation between n and n-1 each time as I understood it, or do they compare the current cohort directly to each previous one. I actually don't understand at all what exactly they did. Also why they are talking about the 2012-2014 cohort suddenly. E2: also is the "preceding cohort" meant to be understood as time or as shown on the graph left to right. This graph could actually indicate that people have gotten richer and richer until the nineties 
Fathis Munk has a new favorite as of 13:18 on Jun 23, 2017 |
|
#
?
Jun 23, 2017 13:06
|
|
|
Fathis Munk posted:Just outta curiosity I actually wanted to plot this using absolute values and not just variations, so I used 100 as my starting value of the very first cohort (for which the time-frame is unspecified)
|
|
#
?
Jun 23, 2017 13:17
|
|
|
Yeah that's why I assumed too and it's what I graphed out. But then I realised that the whole thing is really loving vague.
|
|
#
?
Jun 23, 2017 13:22
|
|
|
Fathis Munk posted:Yeah that's why I assumed too and it's what I graphed out.
|
|
#
?
Jun 23, 2017 13:31
|
|
|

|
|
#
?
Jun 23, 2017 17:23
|
|
|

|
|
#
?
Jun 23, 2017 17:36
|
|


|
So excited for the Adeptus Mechanus codex...
|
|
#
?
Jun 23, 2017 23:00
|
|

|
|
|
#
?
Jun 23, 2017 23:45
|
|
|
Christ, I hate JavaScript
|
|
#
?
Jun 24, 2017 12:36
|
|
|
Okay I get the rationale behind most of those, but how is the tab equal to zero? What's the story there?
|
|
#
?
Jun 24, 2017 14:34
|
|
|

|
| # ? Apr 19, 2024 21:04 |
|
|
mobby_6kl posted:Okay I get the rationale behind most of those, but how is the tab equal to zero? What's the story there? Horrific automatic type coercion from string to number.
|
|
#
?
Jun 24, 2017 14:43
|
|