


|
Count Roland posted:It's not exactly favourable coverage they're getting. I'd find it very surprising if those protests had a measurable affect on these numbers. How much of Trump's hundreds of millions of dollars of free advertisement in 2016 was positive? It doesn't matter how it's spun, the people feeling this way are just hearing "you aren't alone in feeling this way, look at all these protestors" no matter what the talking heads are saying.
|
 #
?
May 12, 2020 01:30
#
?
May 12, 2020 01:30
|
|


|

|
| # ? Apr 16, 2024 05:34 |
|
|
zedprime posted:100% yeah. But you're triggering my inner pedant. i don�t think there are any �inner� pedants in the nearly 300 page pyf graph thread
|
|
#
?
May 12, 2020 01:46
|
|

|
80% of the time I have no idea what you guys are talking about but I just take my cue from other goons and add a 'lol' or 'lmao what a bad graph', hoping that no one will notice that I don't understand statistics
|
|
#
?
May 12, 2020 03:35
|
|


|
Phlegmish posted:80% of the time I have no idea what you guys are talking about but I just take my cue from other goons and add a 'lol' or 'lmao what a bad graph', hoping that no one will notice that I don't understand statistics Have you considered a career in consulting?
|
|
#
?
May 12, 2020 03:36
|
|

|
Phlegmish posted:80% of the time I have no idea what you guys are talking about but I just take my cue from other goons and add a 'lol' or 'lmao what a bad graph', hoping that no one will notice that I don't understand statistics Ah, so which college are you employed as a Dean in?
|
|
#
?
May 12, 2020 03:51
|
|


|
Phlegmish posted:80% of the time I have no idea what you guys are talking about but I just take my cue from other goons and add a 'lol' or 'lmao what a bad graph', hoping that no one will notice that I don't understand statistics Which DC think tank are you a part of?
|
|
#
?
May 12, 2020 03:52
|
|


|
Phlegmish posted:80% of the time I have no idea what you guys are talking about but I just take my cue from other goons and add a 'lol' or 'lmao what a bad graph', hoping that no one will notice that I don't understand statistics Which circuit are you a judge in?
|
|
#
?
May 12, 2020 07:06
|
|


|
Talkie Toaster posted:Well, except there isn�t an actual function there- it�s just saying �r and no of infections will decide when we reopen� but dressing it up as A Science Equation rather than a political choice.
|
|
#
?
May 12, 2020 08:59
|
|


|
https://twitter.com/jd_wilko/status/1260172850343882754
|
|
#
?
May 12, 2020 22:28
|
|


|
So why did they stop testing men toward the end?
|
|
#
?
May 12, 2020 22:32
|
|

|
Platystemon posted:So why did they stop testing men toward the end? So it is a useful graph
|
|
#
?
May 12, 2020 22:44
|
|

|
Platystemon posted:So why did they stop testing men toward the end? Looks like there were ~220 women and ~170 men and both had their own set of ids. For example, there seems to be 50 blue and 50 green dots between 0 and 50
|
|
#
?
May 12, 2020 22:52
|
|

|

|
|
#
?
May 13, 2020 06:08
|
|
|
 code:
|
|
#
?
May 13, 2020 09:06
|
|

|
This doesn't display for me in-thread for some reason.
|
|
#
?
May 13, 2020 13:45
|
|

|
This one is just a reflection of a bad underlying system though. "Do you want to bet that Congress will fully subsidize COBRA?"
|
|
#
?
May 13, 2020 17:16
|
|
|
 
|
|
#
?
May 13, 2020 17:31
|
|

|
This is an interesting case where the figure description gives me all the information I need and the figure does nothing.
|
|
#
?
May 13, 2020 17:47
|
|
|
Yeah if anything the graphic just makes it more confusing which is the exact opposite of what a figure illustration is supposed to do.
|
|
#
?
May 13, 2020 18:55
|
|

|

|
|
#
?
May 13, 2020 19:02
|
|

|

|
|
#
?
May 13, 2020 19:17
|
|
|
The Cheshire Cat posted:Yeah if anything the graphic just makes it more confusing which is the exact opposite of what a figure illustration is supposed to do. In my technical field I work with reactive power. I've heard many analogies to explain the concept of reactive power. However, I've always found that I need to use my understanding of the concept to understand the analogy, which is the opposite of what an analogy I'd supposed to do. These figures feels like that but worse. I can't even use my understanding of confirmation bias to explain what is going on in that second figure. Nevermind, everything clicks now.
|
|
#
?
May 13, 2020 19:25
|
|
|
jjack229 posted:In my technical field I work with reactive power. I've heard many analogies to explain the concept of reactive power. However, I've always found that I need to use my understanding of the concept to understand the analogy, which is the opposite of what an analogy I'd supposed to do. What the diagram claims is happening: the diagram identifies relevant concepts and recieves, analyses and communicates information about them. What really happens: the diagram claims to be connected to concepts, but makes random shapes interpreted by the reader, who in fact is the one who makes all the connections between those shapes and a familiar concept (either relevant or about Pac-Man)
|
|
#
?
May 14, 2020 02:27
|
|

|
https://twitter.com/ScottGottliebMD/status/1260946980710350855
|
|
#
?
May 14, 2020 16:36
|
|
|
|
|
#
?
May 14, 2020 17:19
|
|
|
Interesting way to note "no data" for Washington DC
|
|
#
?
May 14, 2020 17:32
|
|


|
https://mobile.twitter.com/ScottGottliebMD/status/1260946980710350855/photo/3 That 7 day "average" in the 3rd image is either incorrectly calculated or deliberately massaged to make the dropoff seem steeper. The data points at April 14th and 22nd in particular aren't the average of 7 days in any direction, they are way too high. At best, the curve is flattened, and probably not as a peak but as a plateau. E: and why did they only calculate every 7th day when it would be mathematically trivial to do it every single day, which would give a more nuanced representation of the data? That graph's got an agenda. Shit Fuckasaurus has a new favorite as of 18:16 on May 14, 2020 |
|
#
?
May 14, 2020 18:14
|
|

|
Ornamental Dingbat posted:Interesting way to note "no data" for Washington DC No way the results would be that diverse. Im fairly sure this is again one of these �actually only looking at statistical fluctuation and then making up everything� maps.
|
|
#
?
May 14, 2020 19:15
|
|

|
Plastik posted:https://mobile.twitter.com/ScottGottliebMD/status/1260946980710350855/photo/3 The author is a member of the American Enterprise Institute, a "nonpartisan" think tank who's primary agenda is justifying Republican policy.
|
|
#
?
May 14, 2020 19:29
|
|
|
Honj Steak posted:No way the results would be that diverse. Im fairly sure this is again one of these “actually only looking at statistical fluctuation and then making up everything” maps. 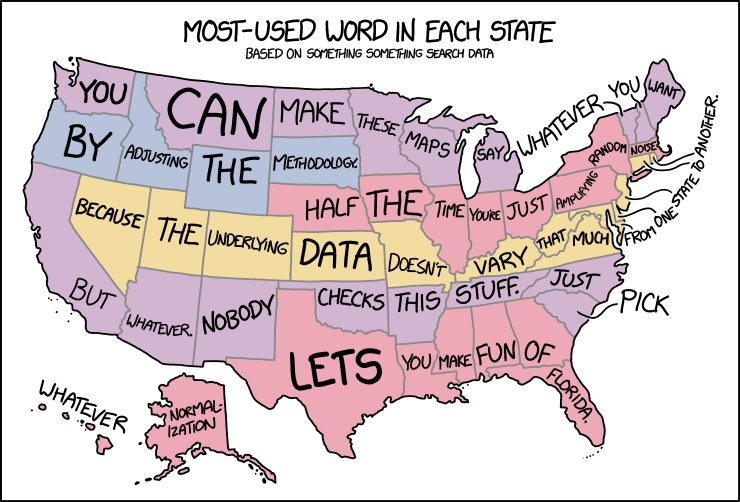
|
|
#
?
May 14, 2020 19:30
|
|
|
Now exclude New York and show the graph. 
|
|
#
?
May 14, 2020 19:44
|
|
|
Big fan of this reply: https://twitter.com/nathannotts/status/1260959911585906696
|
|
#
?
May 14, 2020 20:32
|
|

|
after "peak"
|
|
#
?
May 14, 2020 20:33
|
|


|
It�s a peak in the same way that this is the highest point in Oklahoma.
|
|
#
?
May 14, 2020 20:39
|
|
|
And then you walk awhile more and get to colorado
|
|
#
?
May 14, 2020 20:47
|
|
|
taqueso posted:And then you walk awhile more and get to colorado That's gerrymandering and first past the post for ya.
|
|
#
?
May 14, 2020 20:50
|
|
|
I don't have twitter so feel free to steal, but look at the axis labels on the left and right of the 7 day average chart. The two line graphs are on a different scale
|
|
#
?
May 14, 2020 20:57
|
|

|
If this pandemic has been good for anything, it's showing how most people have zero understanding of statistics, or charts even.
|
|
#
?
May 14, 2020 21:01
|
|


|
lmao what a bad graph
|
|
#
?
May 14, 2020 21:17
|
|
|

|
| # ? Apr 16, 2024 05:34 |
|
|
Bird in a Blender posted:If this pandemic has been good for anything, it's showing how most people have zero understanding of statistics, or charts even. https://twitter.com/wesbury/status/1260953399937376256?s=21
|
|
#
?
May 14, 2020 21:22
|
|