


|
is there a greatest hits of line graphs in particular? I want to use some for a class. I'm definitely including the original Florida stand your ground one.
|
 #
¿
Nov 5, 2019 08:15
#
¿
Nov 5, 2019 08:15
|
|


|

|
| # ¿ Apr 29, 2024 10:41 |
|
|
MrUnderbridge posted:Wait, what's Islington then? A mistake
|
|
#
¿
Dec 16, 2019 07:51
|
|
|
Dave Grool posted:This is not consistent with my experience of the pac nw I mean, there are absolutely tan girls here. they just go to tanning salons or are Latinx
|
|
#
¿
Jan 2, 2020 19:07
|
|
|
Paladinus posted:If it helps, it's supposed to be percentage. this does not help
|
|
#
¿
Feb 21, 2020 16:46
|
|
|
what exactly is it about line graphs that encourages people to use them in the most inappropriate situations?
|
|
#
¿
Mar 18, 2020 17:35
|
|
|
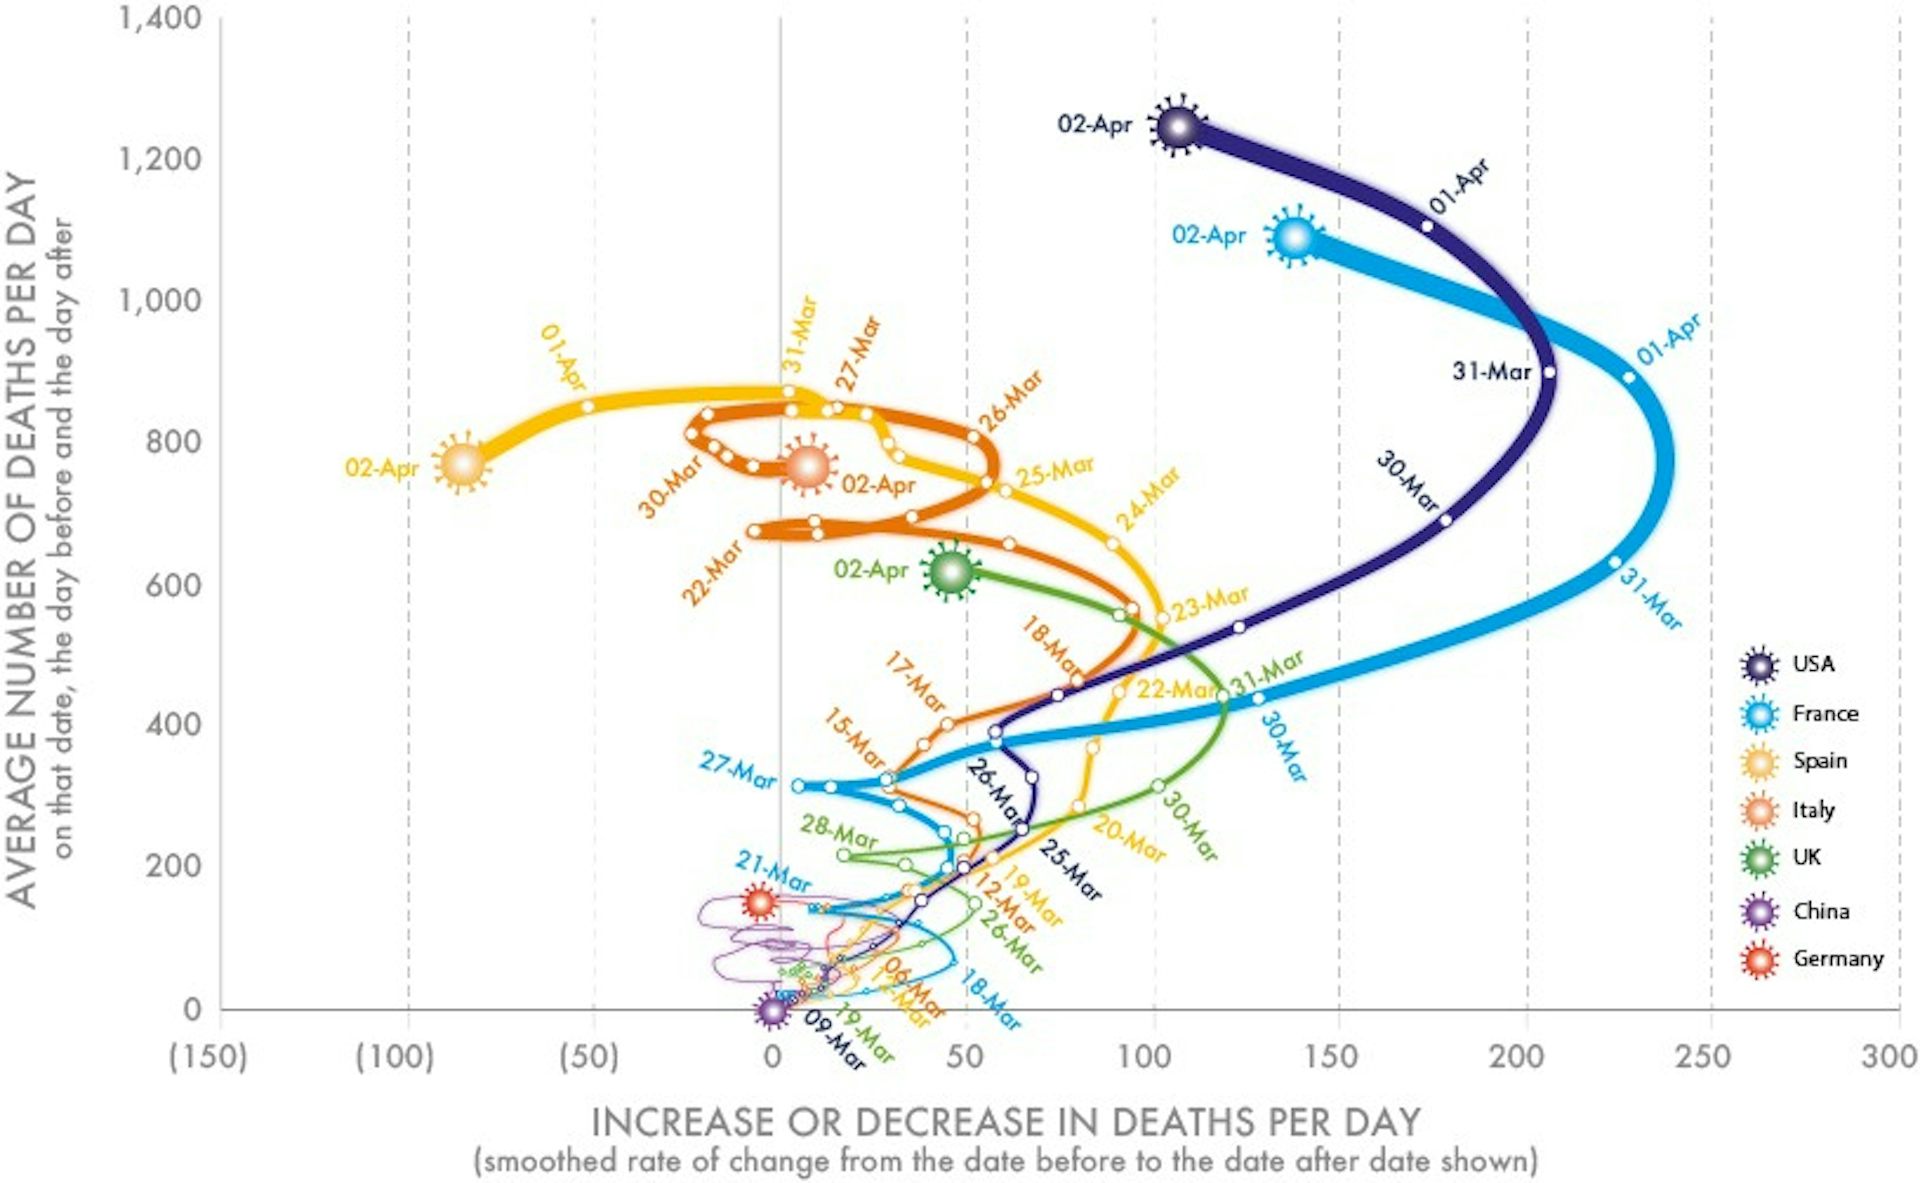
jjack229 posted:A scatter plot with each case as a single, separately colored dot and fatality rate and infection rate as the two axes would be interesting. Not sure if it would be all that useful. I got you fam 
|
|
#
¿
Mar 19, 2020 18:52
|
|
|
listen, I can only add so many dimensions, so if you figure out how to graph something in 4+ dimensions let me know: the bubble size represents incubation period (bigger bubble = longer incubation period)
|
|
#
¿
Mar 19, 2020 19:33
|
|
|
DontMockMySmock posted:Put a regression line on it  I couldn't find good data for the other factors (hospitalisation rate, etc.), but if someone else happens to have a source for it, I'll incorporate it in (perhaps as a colour gradient  ) )
|
|
#
¿
Mar 19, 2020 20:13
|
|
|
ultrafilter posted:Chicken pox is highly leveraged and is driving the fit of your model. Use robust regression. here I made it a polynomial  I mean, here's the data table if anyone wants to go nuts with it: https://docs.google.com/spreadsheets/d/151k8recFTuAc_c6-C-I6DZkeKnTB6q8fFFKdqVcUpRs/edit?usp=sharing
|
|
#
¿
Mar 19, 2020 21:26
|
|
|
vyelkin posted:Put both axes on log scales imo not imaginative enough. I did that AND I normalised the incubation periods and took the absolute value (it won't graph bubbles with negative values) so that the bubbles now represent how many standard deviations they are from the average incubation period of all of them, but you have no idea whether that's higher or lower. 
|
|
#
¿
Mar 20, 2020 00:20
|
|
|
taqueso posted:but i need the trend line for my report *sigh* my work is never done  also if anyone wants an even worse one, I made a version with error bars that, as far as I can tell, are probably meaningless: 
|
|
#
¿
Mar 20, 2020 00:50
|
|
|
Karia posted:
taqueso posted:thanks for the attempt but I needed a more accurate trendline these are both excellent additions
|
|
#
¿
Mar 20, 2020 02:22
|
|


|
taqueso posted:holy poo poo groundfloor I want a co-author credit on the journal article
|
|
#
¿
Mar 20, 2020 02:33
|
|
|
Tree Bucket posted:Can we have a specially-jpeg'd version of this information for posting to Facebook? in general I'm all for enjoying bad graphs, but I feel like unless your Facebook friend list is very different than mine, the joke is going to be lost on people and it'll just end up being a bunch of misinformed people receiving what they think is legitimate information (because graphs are never wrong, and graphs with science-y words are DEFINITELY never wrong) and passing it on.
|
|
#
¿
Mar 20, 2020 04:12
|
|
|
they clearly just made the diagram based on the original quote before it was revised "The fear of not being enough, and the fear of being too much intersect to form a non-empty set which is where the true fear is"
|
|
#
¿
Mar 23, 2020 01:14
|
|

|
 from the lack of gradient in the legend to the lack of range in the legend, there's just so much to love here. it's rather legend-ary
|
|
#
¿
Mar 24, 2020 19:53
|
|

|
Kangxi posted:This is likely what is called a "dead cat bounce" yeah, I do love posting stock exchange information as though that gain happened in a vacuum with nothing else around it. it's not like it fell like 6000 points right before that or anything.
|
|
#
¿
Mar 26, 2020 21:32
|
|
|
 are these ever a good idea?
|
|
#
¿
Aug 3, 2020 15:16
|
|
|
dwarf74 posted:That's actually a pretty important finding of cognitive psychology, called the Stroop Effect. I used it when I taught psychology a couple years ago and watching kids try to read it out was marvelous
|
|
#
¿
Aug 4, 2020 19:03
|
|
|
maybe I'm just having a moment but I do not understand anything about those x-axes
|
|
#
¿
Aug 27, 2020 00:43
|
|
|
Legendary Ptarmigan posted:Horizontal axis is 2016 Trump vote share, as a percentage for each media market. The seven different graphs each have their own axis from 20-80%. Vertical axis is sort of shared and represents percentage of searches pertaining to that sport compared to the total of all seven. okay yeah I was just having a brain = bad moment. that makes way more sense. Mr.Radar posted:Hmm, yes, when I think of camping I think of food that needs to stay frozen before preparation. I take refrigerated/frozen foods camping all the time when I go. cooler filled with ice. but then I don't go like wilderness camping out in the middle of nowhere.
|
|
#
¿
Aug 28, 2020 00:14
|
|
|

|
|
#
¿
Sep 7, 2020 18:04
|
|
|
Son of Thunderbeast posted:This could make sense if the 0 on the X axis is between the two Es in "several times a week" it's the chart that keeps on giving. for instance, it comes from "Pew research Teen's Relationship Study", which means all this data comes from one teen or Pew is hiring teens to do their research now
|
|
#
¿
Sep 7, 2020 18:23
|
|
|
OTOH maybe we should be glad some of the fields aren't trying to interact with each other https://twitter.com/yellingatwind/status/1301700119419432960
|
|
#
¿
Sep 8, 2020 16:17
|
|
|
FreeKillB posted:
voting participation is the new dick size. "Yeah my participation is twice the size of an average one"
|
|
#
¿
Sep 13, 2020 01:18
|
|

|

|
| # ¿ Apr 29, 2024 10:41 |
|
|
SgtScruffy posted:That fuckin' bridge in Whodunnit that causes you to drop the matches how long is it in the game before you figure out that the matches are ruined and you can't do the thing you need them for? I don't think it's like Sierra King's Quest long with that loving rat you need in the first 20 minutes or whatever, but is it long enough that you'd probably have saved since then?
|
|
#
¿
Sep 30, 2020 03:58
|
|
